岁月静好
凡所有相,皆是虛妄,若見諸相非相,則見如來


In this article:
-
$JEPI & $JEPQ are better hedges than they are income ETFs
-
$JEPI & $JEPQ & $QYLD long terms returns are not as great as one might think
Seeking Alpha Link to Follow Along and Most Recent Data - Make sure to change Metric to “Total Return” - Does not default)
All data and charts used were pulled from Seeking Alpha on April 6th, 2023
Introduction:
Three of the most wildly popular ETFs in the covered call strategy are $JEPI, JEPQ & $QYLD. I’m sure you’ve come across these tickers and people going gaga over it. While most people own these ETFs for income, here is why I think they make much better hedges. For this article, I would specifically like to focus on $JEPI & $JEPQ as hedges. I will be using $QYLD (and I added $SCHD) only for some long term comparison & for frame of reference. The only similarity between $QYLD, $JEPI & $JEPQ is that they are covered call strategies. The underlying is different and hence the performance in the long run could/should be different.
Also for some fun, when I do these articles, oftentimes I don’t know what the end result is going to be, I don’t know which stock will deliver the best return and so on. But for this article, I am going to bet that $SCHD will take the cake.
What are covered calls:
Covered calls are a neutral strategy, meaning the investor only expects a minor increase or decrease in the underlying stock price for the life of the written call option. This strategy is often employed when an investor has a short-term neutral view of the asset and for this reason, holds the asset long and simultaneously has a short position via the option to generate income from the option premium.
Source: Investopedia
Individual ETFs Strategy:
Here is a quick breakdown of what these ETFs are and some data:
Here is how J. P. Morgan explains how JEPI works:
We use fundamental bottom-up research to build a higher-quality, lower-beta portfolio of U.S. large cap equities with less volatile earnings and share prices. We then sell index options against that long-only portfolio and use the premiums to generate income. The result is a conservative equity income strategy designed to reduce downside exposure by forgoing some upside participation.
Covered call strategy for US Large Cap stocks based on quality and beta.
Read the full article here.
Total Number of Holdings: 134
Expense Ratio: 0.35%
Here is how J. P. Morgan explains how JEPQ works:
JEPQ comprises a portfolio of equity securities of large cap companies included in the Nasdaq-100 Index® and incorporates an options strategy to generate income while lowering the volatility of the overall portfolio. This management style aims to deliver returns, offer incremental income and better manage risk within portfolios as investors navigate today’s rising rate and inflationary environment.
Covered call strategy for Large Cap Nasdaq stocks based on quality and beta.
You can read more about it here.
Total Number of Holdings: 84
Expense Ratio: 0.35%
Here is how Global X explains how QYLD works:
The Global X Nasdaq 100 Covered Call ETF (QYLD) is designed to offer investors with potential monthly income while seeking to lower the risks of investing in a major US index through a strategy that writes monthly covered call options on the Nasdaq 100 Index
Covered call strategy on the Nasdaq 100.
You can read more about it here.
Total Number of Holdings: 103
Expense Ratio: 0.6%
Expense Ratio: 0.06%
Detailed Article here.
Summary:
So JEPI & JEPQ are hand picking the stocks that have low volatility and a higher P/E than the market and sell covered calls against those stocks because they are already more expensive than the market (reducing the probability of them going much higher) and even if they do move higher, they won’t move a lot (because they are low volatility). Making them the perfect targets to sell covered calls against.
QYLD on the other hand is simply working at the index level and hence is less of a hedge.
QYLD’s expense ratio is 72% higher than JEPQ & JEPI, SCHD’s expense ratio is lowest
Here is why I think these are hedges:
These ETFs continue to pay good (sometimes shockingly great) monthly dividends as long as their underlying stocks either go sideways or if they go lower.
So in a bear market, I continue to get income, while technically holding high quality or low beta or Nasdaq 100 stocks.
However, the magic happens when the underlying stocks start going up, the covered call strategy will likely not generate a ton of income in the upcoming month, but the ETF price itself is going up because the underlying equity is going up.
How I Trade JEPI & JEPQ:
-
Religiously dollar cost averaging if the market is down or sideways > reinvest dividend
-
When markets recover, I sell ETF for a profit > take dividend as cash
-
If the market turns lower, I buy back the ETF at a lower price and dollar cost average > reinvest dividend
-
Repeat
I tested this strategy doing the recent bear market, where I added to our position when $JEPI & JEPQ were below my buy price and sold for a profit each time it went higher.
Logic:
My upside is capped, so there is no point holding the ETF if the underlying stocks are going up, so start selling your equity at a profit or break even over time, as it goes up. Dollar cost averaging makes it easier to stay close to the average buy price, helping me sell early once the market starts rising. Even if I sell only at break even, all the dividend income I made while I held the ETF is profit.
The exit is built into the strategy. The longer I hold on to the ETF in a rising market, the larger the opportunity cost.
Disadvantages of using these ETFs as hedges:
For these ETFs, the income is the hedge, not the equity. But unlike normal hedges, I will not be able to exit my position or receive those income payouts in the moment the markets are crashing.
Hence, this strategy should only be used as a hedge to support the portfolio over a period of time, in uncertain, sideways or bearish markets.
Let’s look at total return:
I threw $SCHD & $VOO in there, my favourite dividend and broad market coverage ETF for frame of reference - You can read the full article here: The Ideal US Equity ETF Portfolio).
The primary goal to go through these charts is to:
-
Show that these ETFs may not be the best option to generate wealth over a longer period of time.
-
The returns in the last 2-3 years are exceptional as it is the ideal environment for such a strategy to flourish and that these ETFs will be left behind when the market starts pushing higher.
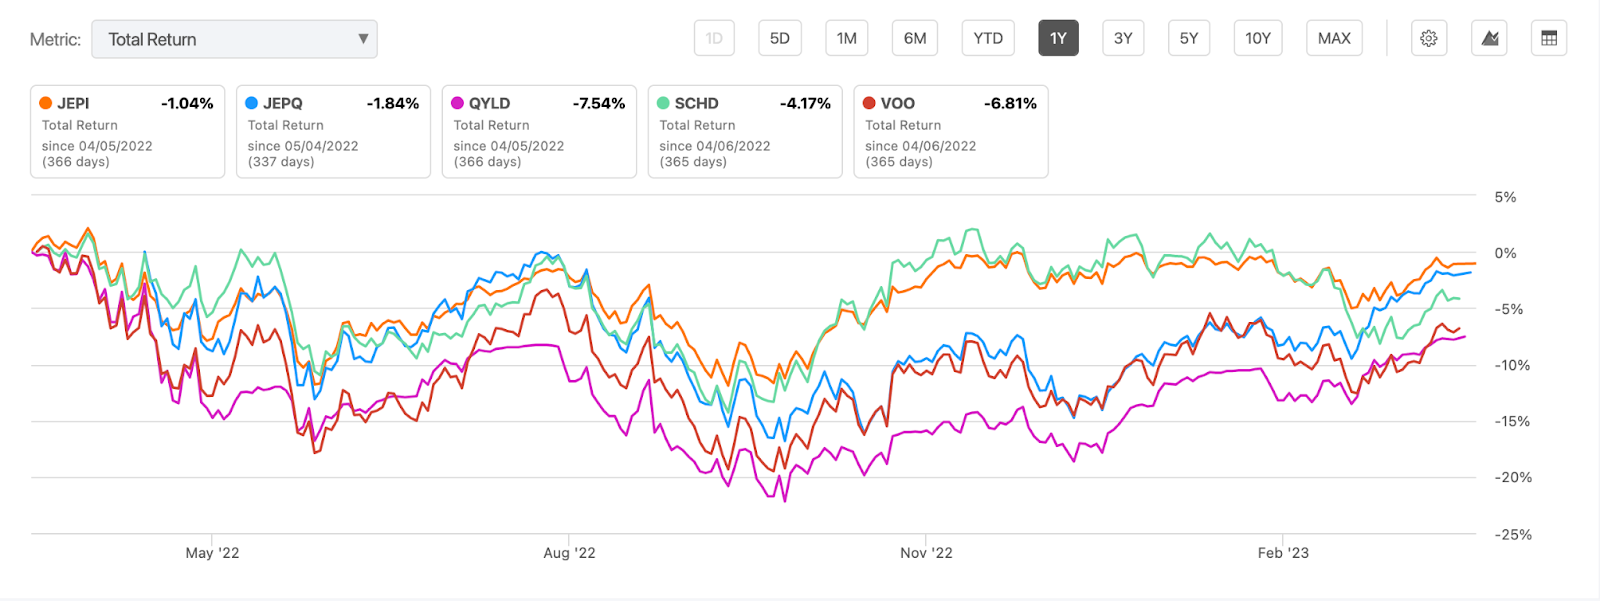
1 Year Chart:
-
JEPQ is 11 months old, so the only real comparison between the 4 ETFs will have to be done for the last 1 year total return, which is not particularly helpful because we cannot establish any trend or long term return based on 1 year.
-
I'll leave the chart below but not dwell on it for too long. But you can see $JEPI and $JEPQ both delivered better total returns than $SCHD & $VOO, giving some credence to my argument that $JEPI and $JEPQ are hedges.
3 Year Chart:
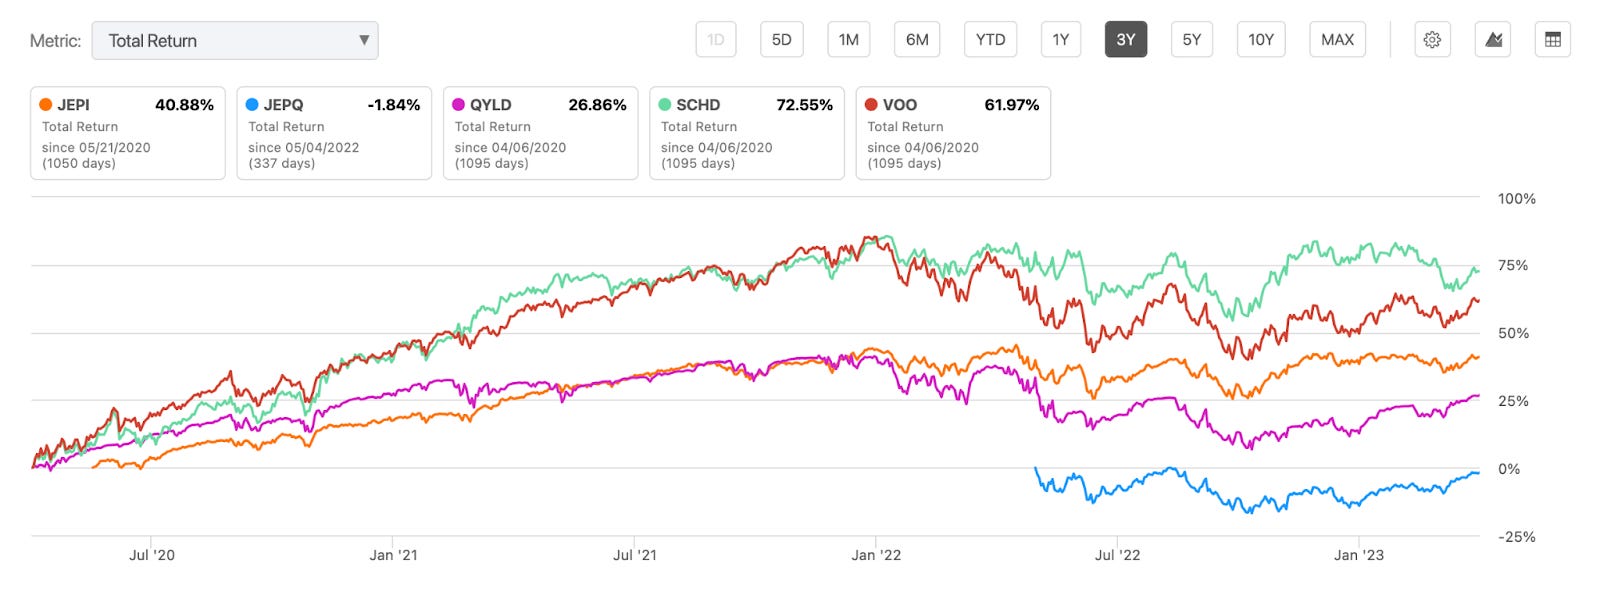
Ooh! Things get more interesting when we look at the 3 year chart.
-
$JEPQ is out owing to lack of data, ignore it
-
$SCHD clear winner, followed by $VOO
-
$JEPI & $QYLD are not even in the same zip code
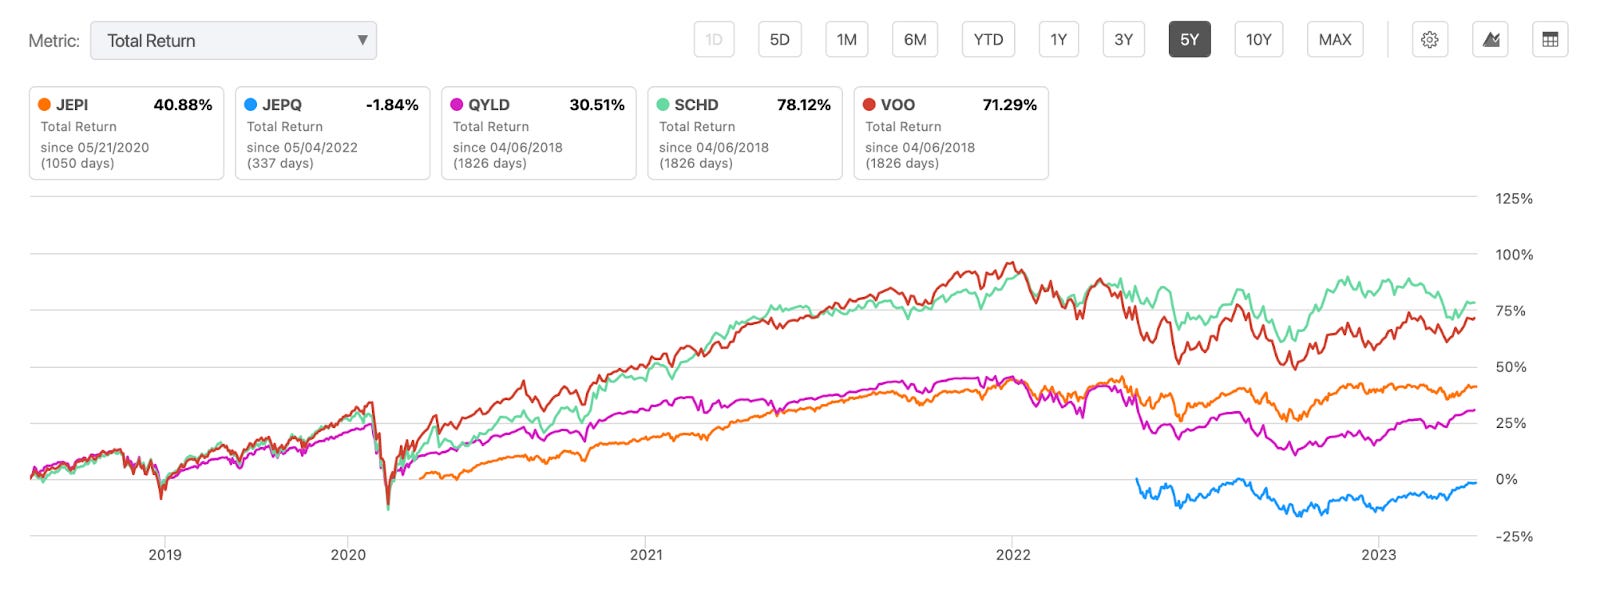
5 Year Chart:
-
$SCHD clear winner, followed by VOO 0.01%↑
10 Year Chart:
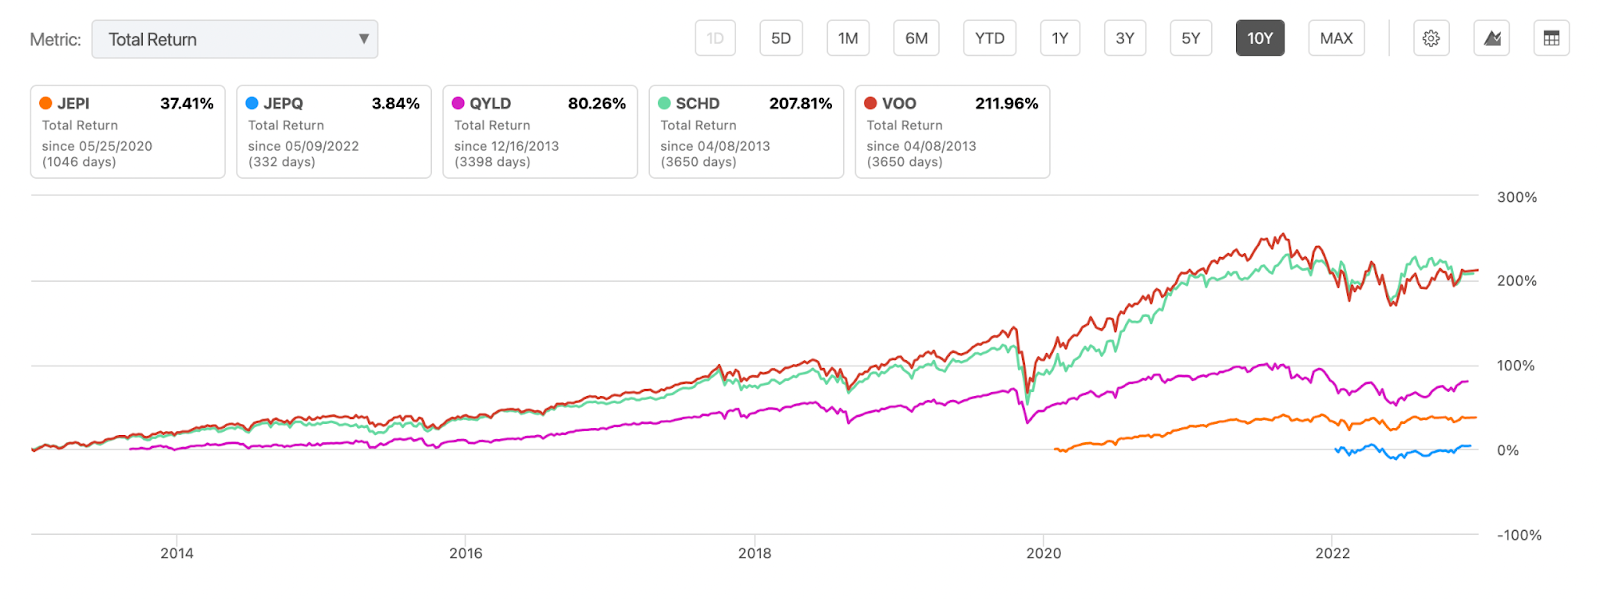
-
The primary reason I included $QYLD as part of this exercise is because it is the closest strategy to $JEPI and $JEPQ that I can compare with $SCHD and $VOO on a 10 year Total Return basis.
-
And yes, no surprises, $SCHD reigns supreme
-
$VOO is beating $QYLD hands down too, does not bode well for a long term strategy.
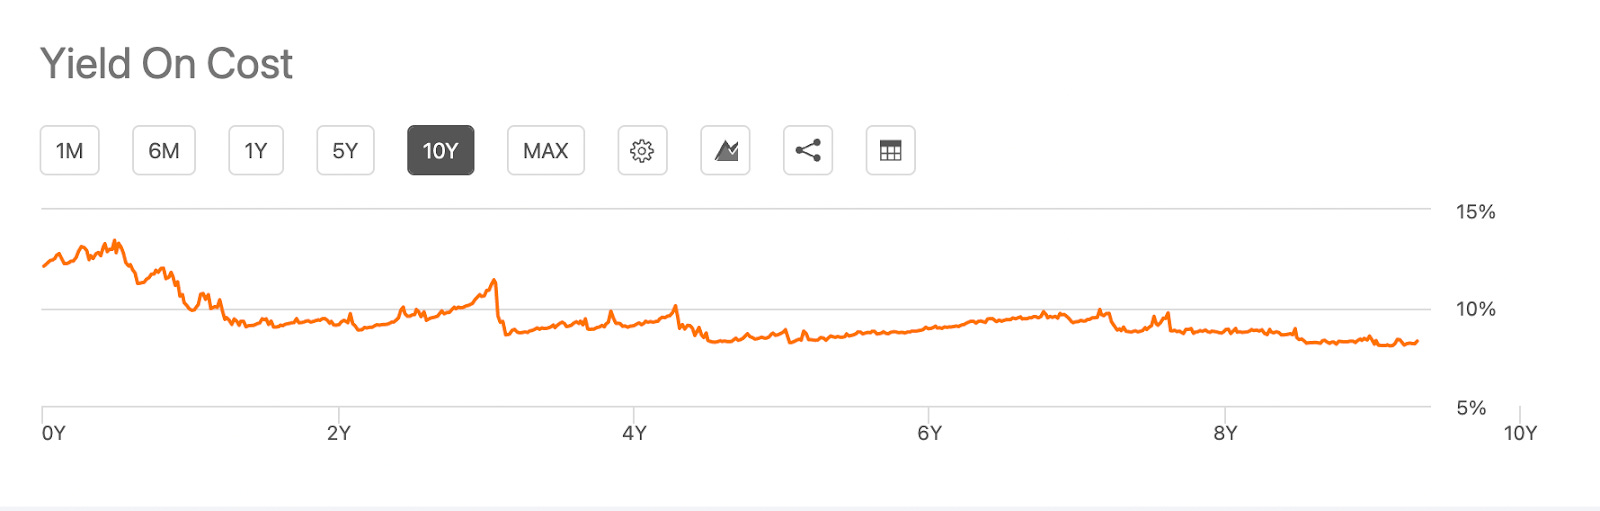
Now let’s take a look at Dividends:
Yes these ETFs pay a very good (sometimes great) dividends, but let's dive deeper. In this section we will take a look at Yield on Cost - This will also justify why Dollar Cost Averaging is the best strategy for these ETFs
Yield on cost (YOC) is a measure of dividend yield calculated by dividing a stock's current dividend by the price initially paid for that stock. For example, if an investor purchased a stock five years ago for $20, and its current dividend is $1.50 per share, then the YOC for that stock would be 7.5%.
Source: Investopedia
$SCHD: Let’s start with what good looks like
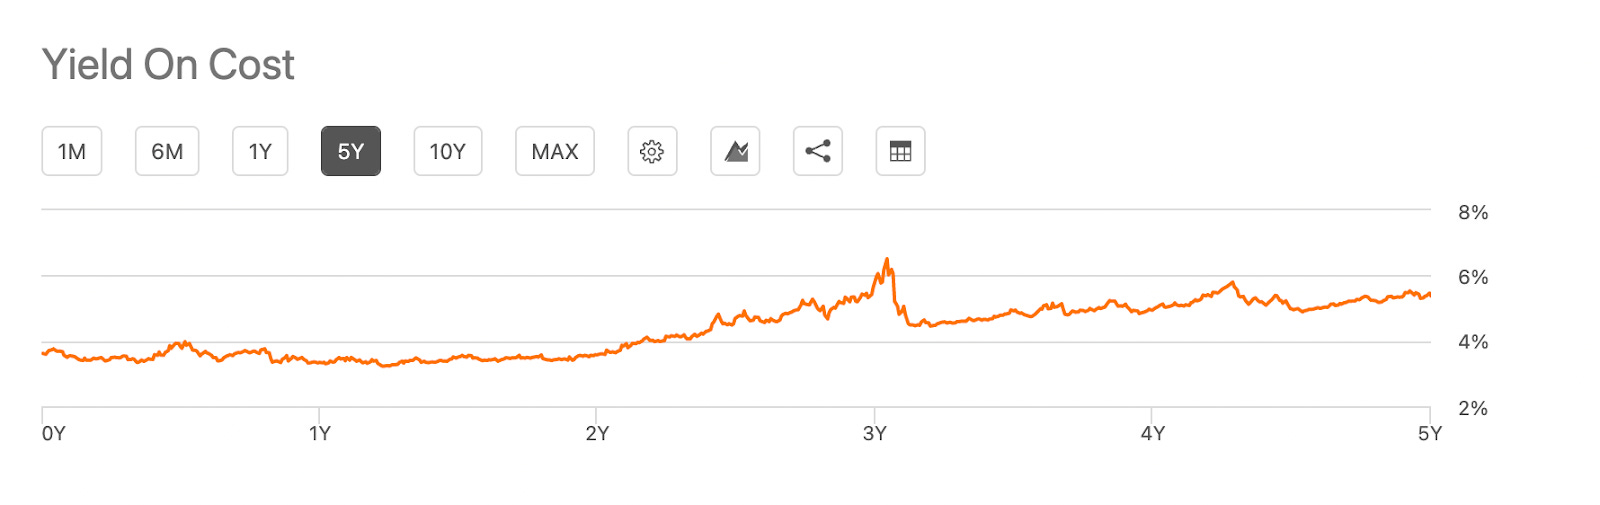
-
You want to see this chart go from bottom left, up into the right - upward sloping.
-
So you bought the stock when the dividend yield was just below 4% but over time, your equity has grown, so while the dividend yield may not have gone up to 5.5%, that's effectively what you are making on the money you invested 5 years ago.
-
$SCHD has grown their divided in the last 10 consecutive years
$JEPI
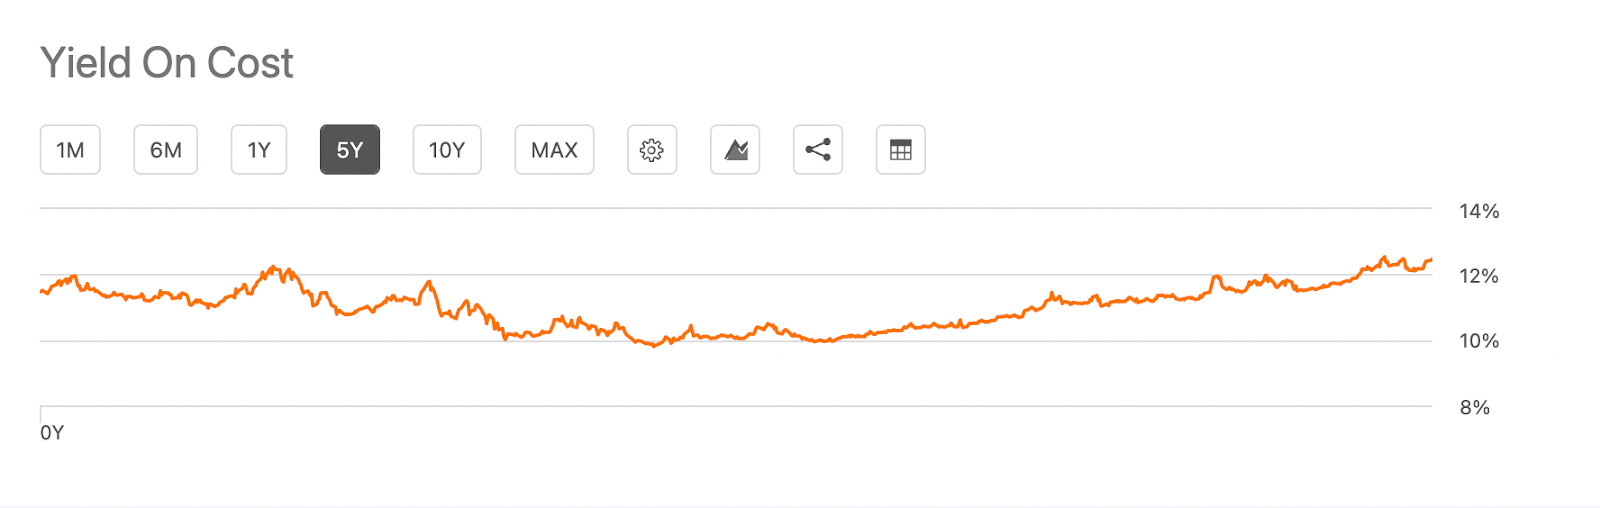
-
So this chart actually does not look as bad as I thought it would look
-
As you can see the yield has recovered which makes me sort of more interested in $JEPI (Read $JEPQ for complete POV)
-
$JEPI has increased their dividend 2 years in a row
$JEPQ
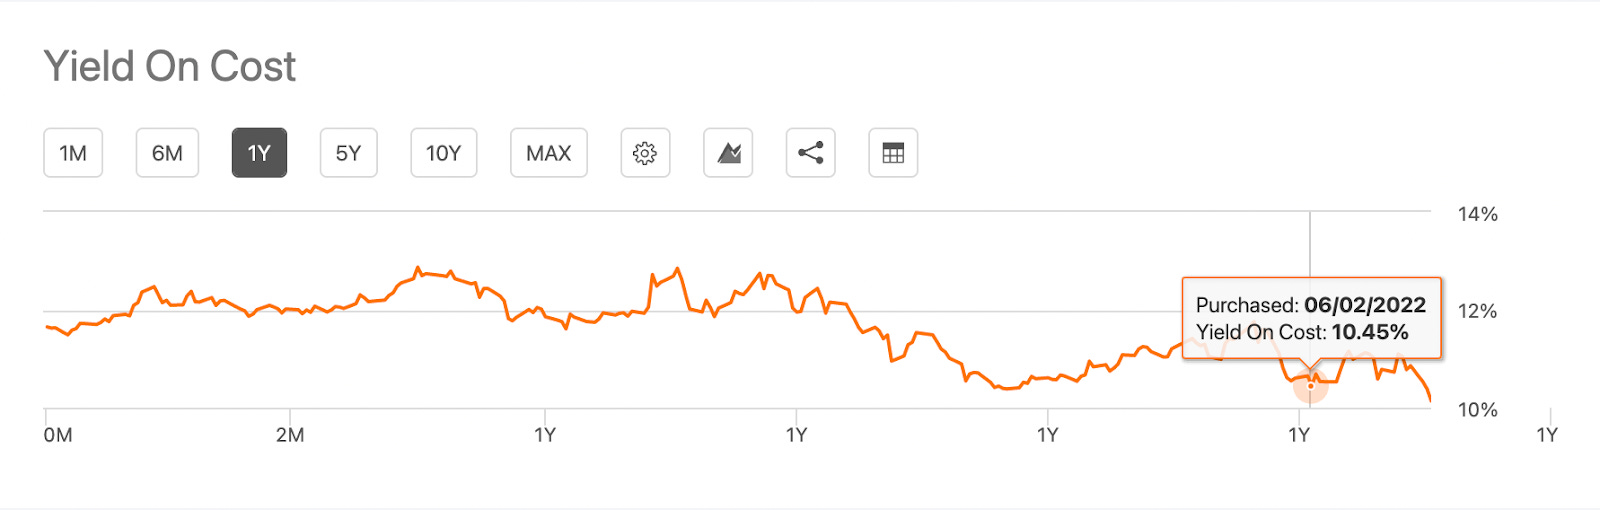
-
While we don’t have enough data on $JEPQ (only 1 year). I can tell you from personal experience, $JEPQ is delivering better returns for me than $JEPI in the short term - the 6 month chart confirms it
-
$JEPQ is only a year old.
$QYLD